Quick Start#
This chapter provides a rapid overview of analyzing the performance of an application using HPCToolkit. It assumes an operational installation of HPCToolkit.
Guided Tour#
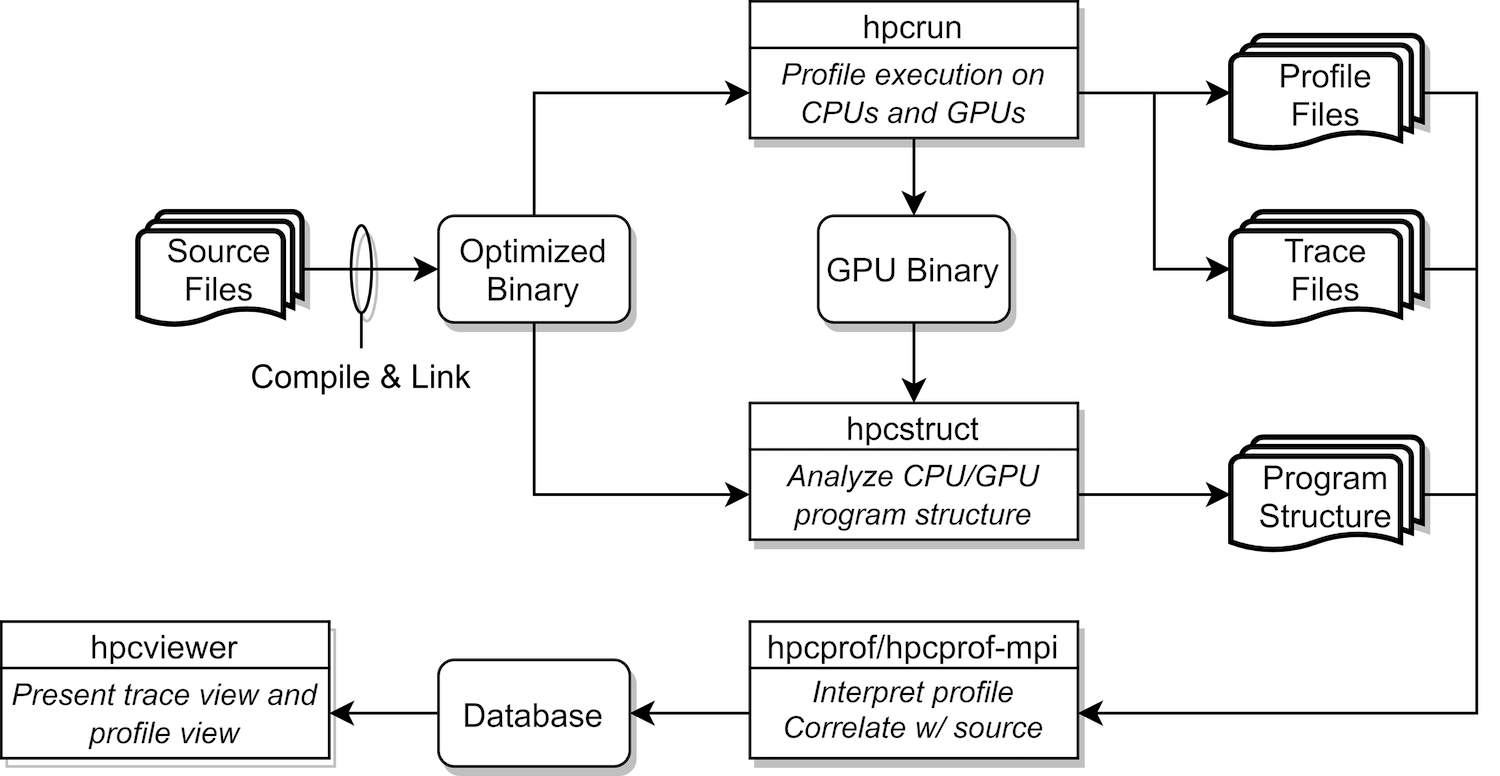
Figure 3.1: Overview of HPCToolkit tool’s work flow.#
HPCToolkit’s work flow is summarized in Figure 3.1 and is organized around four principal capabilities:
measurement of context-sensitive performance metrics while an application executes;
binary analysis to recover program structure from CPU and GPU binaries;
attribution of performance metrics by correlating dynamic performance metrics with static program structure; and
presentation of performance metrics and associated source code.
To use HPCToolkit to measure and analyze an application’s performance, one first compiles and links the application for a production run, using full optimization.
Second, one launches an application with HPCToolkit’s measurement tool, hpcrun, which uses statistical sampling to collect a performance profile.
Third, one applies hpcstruct to an application’s measurement directory to recover program structure information from any CPU or GPU binary that was measured.
Program structure, which includes information about files, procedures, inlined code, and loops, is used to relate performance measurements to source code.
Fourth, one uses hpcprof to combine information about an application’s structure with dynamic performance measurements to produce a performance database.
Finally, one explores a performance database with HPCToolkit’s graphical user interface: hpcviewer which presents
both a code-centric analysis of performance metrics and a time-centric (trace-based) analysis of an execution.
The following subsections explain HPCToolkit’s work flow in more detail.
Compiling an Application#
For the most detailed attribution of application performance data using HPCToolkit, one should compile so as to include with line map information in the generated object code.
This usually means compiling with options similar to -g -O3. Check your compiler’s documentation for information about the right set of options to have the compiler record information about inlining and the mapping of machine instructions to source lines.
We advise picking options that indicate they will record information that relates machine instructions to source code without compromising optimization.
Additionally, specifying flags that cause a compiler to record mappings of machine instructions to inlined code are particularly useful for performance analysis of codes that employ C++ templates.
While HPCToolkit does not need information about the mapping between machine instructions and source code to function, having such information included in the binary code by the compiler can be helpful to users trying to interpret performance measurements. Since compilers can usually provide information about line mappings and inlining for fully-optimized code, this requirement usually involves a one-time trivial adjustment to the an application’s build scripts to provide a better experience with tools. Such mapping information enables tools such as HPCToolkit to attribute performance metrics to source code constructs within procedures rather than only at the procedure level.
Measuring Application Performance#
Today, HPCToolkit is designed to measure executions of dynamically-linked applications.
To monitor a dynamically linked application, simply use hpcrun to launch the application.
An application may be sequential, multithreaded or based on MPI.
The commands below give examples for an application named app.
Dynamically linked applications:
Simply launch your application with
hpcrun:[<mpi-launcher>] hpcrun [hpcrun-options] app [app-arguments]
Of course,
<mpi-launcher>is only needed for MPI programs and is sometimes a program likempiexecormpirun, or a workload manager’s utilities such as Slurm’ssrunor IBM’s Job Step Manager utilityjsrun.
hpcrun will produce a measurements database that contains separate measurement information for each MPI rank and thread in the application. The database is named according the form:
hpctoolkit-app-measurements[-<jobid>]
If the application app is run under control of a recognized batch job scheduler (such as Slurm, Cobalt, or IBM’s Job Manager), the name of the measurements directory will contain the corresponding job identifier <jobid>.
Currently, the database contains measurements files for each thread that are named using the following templates:
app-<mpi-rank>-<thread-id>-<host-id>-<process-id>.<generation-id>.hpcrun
app-<mpi-rank>-<thread-id>-<host-id>-<process-id>.<generation-id>.hpctrace
Specifying CPU Sample Sources#
HPCToolkit primarily monitors an application using asynchronous sampling.
Consequently, the most common option to hpcrun is a list of sample sources that define how samples are generated.
A sample source takes the form of an event name e and howoften, specified as e@howoften. The specifier howoften may
be a number, indicating a period, e.g. CYCLES@4000001 or it may be f followed by a number, CYCLES@f200 indicating a frequency in samples/second.
For a sample source with event e and period p, after every p instances of e, a sample is generated that causes hpcrun to inspect the and record information about the monitored application.
To configure hpcrun with two samples sources, e1@howoften1 and e2@howoften2, use the following options:
--event e1@howoften1 --event e2@howoften2
Measuring GPU Computations#
One can simply profile and optionally trace computations offloaded onto AMD, Intel, and NVIDIA GPUs by using one of the following event specifiers:
-e gpu=nvidiais used with CUDA and OpenMP on NVIDIA GPUs-e gpu=amdis used with HIP and OpenMP on AMD GPUs-e gpu=level0is used with Intel’s Level Zero runtime for Data Parallel C++ and OpenMP-e gpu=openclcan be used on any of the GPU platforms.
Adding a -t to hpcrun’s command line when profiling GPU computations will trace them as well.
To support more intuitive tracing results of GPU-accelerated programs, hpcrun also supports a -tt option for boosted resolution tracing. Using this flag causes the calling context of CPU threads to be recorded in their traces each time they launch a GPU operation. This option is particularly helpful when tracing codes that launch GPU operations more often than default CPU sampling frequency.
More information about instruction-level performance measurement of GPU kernels is available in a section of this manual that describes support for Measurement and Analysis of GPU-accelerated Applications.
Recovering Program Structure#
When hpcrun measures the performance of an application, it associates performance information with machine code addresses. To relate performance information associated with machine code addresses back to source code locations, HPCToolkit provides a tool hpcstruct that analyzes CPU and GPU binaries associated with an execution to recover program structure. Program structure for a binary includes information about its source files, procedures, inlined code, loop nests, and statements. Program structure for a binary is recovered by combining source code mapping information recorded by compilers (when apprpropriate compile time arguments, e.g. -g, are used) with information about loops that hpcstruct gleans from analyzing the control flow between machine instructions in the binary.
Typically, one launches hpcstruct without any options and one argument that specifies a HPCToolkit measurement directory.
hpcstruct hpctoolkit-app-measurements
From a measurement directory,
hpcstruct identifies the application, any shared libraries it loads, and any GPU binaries that it invokes.
hpcstruct processes each of CPU and GPU binary and records information about its program structure into the measurements directory.
Program structure for a binary includes information about its source files, procedures, inlined code, loop nests, and statements.
When applied to a measurements directory, hpcstruct analyzes multiple binaries concurrently.
It analyzes each small binary using a few threads and each large binary using more threads.
Normally, hpcstruct uses a pool of threads equal to half of the available hardware threads.
If you want to adjust this value (higher or lower), use the -j|--jobs option.
hpcstruct -j <num-jobs> measurements-directory
Although not usually necessary, one can apply hpcstruct to recover program structure information for a single CPU or GPU binary.
To recover static program structure for a single binary b, use the command:
hpcstruct b
This command analyzes the binary and saves this information in a file named b.hpcstruct.
Tip
On rare occasions, there may be a module file for which hpcstruct
takes an excessive amount of time to analyze.
For example, on Aurora at ALCF, the libmpi.so.12.5.0 library takes
30-40 minutes to analyze and the older libmpi.so.12.4.3 takes about 2 hours.
When this happens, if the module file is not essential to understanding the
application’s performance, you can skip that module with the -x|--exclude option.
Specify the module’s path name or file name.
For example:
hpcstruct -x /path/to/file-name measurements-directory
hpcstruct -x file-name measurements-directory
By default, hpcstruct skips certain known files.
If you need detailed analysis of a binary that would otherwise be skipped,
use the -i|--include option.
hpcstruct -i file-name measurements-directory
You can see a list of all binaries associated with an execution’s
measurements directory with the --show-files option.
hpcstruct --show-files measurements-directory
In practice, hpcstruct analyzes most CPU or GPU binaries in less than a minute,
so these options are normally not needed.
Caching Structure Results#
Hpcstruct can cache the results of the structure files.
This can be useful if you profile your application multiple times but
most of its module files are unchanged.
The simplest way to use the cache is to set the HPCTOOLKIT_HPCSTRUCT_CACHE
environment variable to a directory where you want to store the cache.
For example (using bash),
export HPCTOOLKIT_HPCSTRUCT_CACHE=/path/to/cache/directory
While caching structure results is useful to avoid repeating analysis
of common files and we recommend this for all users, note that
hpcstruct does not have a default location for HPCTOOLKIT_HPCSTRUCT_CACHE.
This is to avoid inadvertently capturing information about
applications with restricted access (e.g. export controlled codes) and
saving it to an inappropriate location in the filesystem.
You can also specify the cache directory on the command line with the
-c|--cache option.
This option might be attractive if you are analyzing measurement data
for an application with restricted access and want to control where
information about it is saved.
hpcstruct -c /path/to/cache/directory measurements-directory
Warning
Caching the structure files involves copying the CPU and GPU binaries and libraries into the cache directory. If your application has restricted access, be careful where you put the cache directory and be sure to restrict the directory permissions.
Attributing Measurements to Source Code#
To analyze HPCToolkit’s measurements and attribute them to the application’s source code, use hpcprof, typically invoked as follows:
hpcprof hpctoolkit-app-measurements
This command will produce an HPCToolkit performance database with the name hpctoolkit-app-database.
If this database directory already exists, hpcprof will form a unique name by appending a random hexadecimal qualifier.
hpcprof performs this analysis in parallel using multithreading.
By default all available threads are used.
If this is not wanted (e.g. using sharing a single machine), the thread count can be specified with -j <threads>.
hpcprof usually completes this analysis in a matter of minutes.
For especially large experiments (applications using thousands of threads and/or GPU streams), the sibling hpcprof-mpi may produce results faster by exploiting additional compute nodes[3].
Typically hpcprof-mpi is invoked as follows, using 8 ranks and compute nodes:
<mpi-launcher> -n 8 hpcprof-mpi hpctoolkit-app-measurements
Note that additional options may be needed to grant hpcprof-mpi access to all threads on each node, check the documentation for your scheduler and MPI implementation for details.
If possible, hpcprof will copy the sources for the application and any libraries into the resulting database.
If the source code was moved since or was mounted at a different location than when the application was compiled, the resulting database may be missing some important source files.
In these cases, the -R/--replace-path option may be specified to provide substitute paths based on prefixes.
For example, if the application was compiled from source at /home/joe/app/src/ but it is mounted at /extern/homes/joe/app/src/ when running hpcprof, the source files can be made available by invoking hpcprof as follows:
hpcprof -R `/home/joe/app/src/=/extern/homes/joe/app/src/' \
  hpctoolkit-app-measurements
Note that on systems where MPI applications are restricted to a scratch file system, it is the users responsibility to copy any wanted source files and make them available to hpcprof.
Presenting Performance Measurements for Interactive Analysis#
To interactively view and analyze an HPCToolkit performance database, use hpcviewer.
hpcviewer may be launched from the command line or by double-clicking on its icon on MacOS or Windows.
The following is an example of launching from a command line:
hpcviewer hpctoolkit-app-database
Additional help for hpcviewer can be found in a help pane available from hpcviewer’s Help menu.
Effective Performance Analysis Techniques#
To effectively analyze application performance, consider using one of the following strategies, which are described in more detail in Chapter 4.
A waste metric, which represents the difference between achieved performance and potential peak performance is a good way of understanding the potential for tuning the node performance of codes (Section 4.3).
hpcviewersupports synthesis of derived metrics to aid analysis. Derived metrics are specified withinhpcviewerusing spreadsheet-like formula. See thehpcviewerhelp pane for details about how to specify derived metrics.Scalability bottlenecks in parallel codes can be pinpointed by differential analysis of two profiles with different degrees of parallelism (Section 4.4).
Additional Guidance#
For additional information, consult the rest of this manual and other documentation: First, we summarize the available documentation and command-line help:
- Command-line help:
Each of HPCToolkit’s command-line tools can generate a help message summarizing the tool’s usage, arguments and options. To generate this help message, invoke the tool with
-hor--help.- Man pages:
Man pages are available online or in a local HPCToolkit installation (
<hpctoolkit-installation>/share/man).- Manuals:
Manuals are available either online or from a local HPCToolkit installation (
<hpctoolkit-installation>/share/doc/hpctoolkit/documentation.html).- Papers:
Papers that describe various aspects of HPCToolkit’s measurement, analysis, attribution and presentation technology can be found on the HPCToolkit website.